Interface concept
Industrial Data Dashboard
A supervisory interface for PLC-based production monitoring, signal quality and event history.
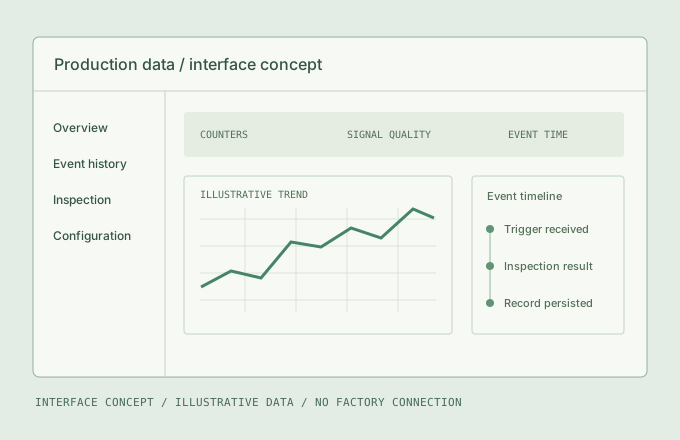
The visual is an interface mockup with illustrative trend data. It has no factory connection and makes no claim about live production or customer results.
The engineering question
How can an interface make machine data useful without hiding gaps, stale values or inconsistent timestamps?
Proposed scope
- Read-only production counters and machine-state signals
- Timestamp and quality information shown with each source
- Inspection and event-history views
- Traceable exports with explicit data boundaries
Reference decision path
01 →PLC / equipment signals
02 →Gateway + timestamps
03 →Validate units / quality
04 →Persist records
05 →Dashboard + event review
06 / OUTPUTExport for analysis
Validation plan
- Compare displayed counters with source values.
- Test disconnects, duplicates and clock drift.
- Check that exports match the underlying event records.
Start with the engineering problem
What does your process
need to do better?
Share the part, the machine, the constraint and the result you need. That is the starting point for a useful technical conversation.